Characterisation of weak magnetic field effects in an aqueous
glutamic acid solution by nonlinear dielectric spectroscopy and voltammetry
Alexander Pazur*
Address: Department Biologie 1 Universitat
Mtinchen-Bereich Botanik, Menzingerstr. 67, D-80638 Munchen, Germany
Email: Alexander Pazur* - a.pazur@lrz.uni-muenchen.de
* Corresponding author
Abstract
Background: Previous reports indicate altered
metabolism and enzyme kinetics for various organisms, as well as changes of
neuronal functions and behaviour of higher animals, when they were exposed to
specific combinations of weak static and alternating low frequency
electromagnetic fields. Field strengths and frequencies, as well as properties
of involved ions were related by a linear equation, known as the formula of ion
cyclotron resonance (ICR, abbreviation mentioned first by Liboff). Under
certain conditions already a aqueous solution of the amino acid and
neurotransmitter glutamate shows this effect.
Methods: An aqueous solution of glutamate was exposed
to a combination of a static magnetic field of 40 цТ and a
sinusoidal electromagnetic magnetic field (EMF) with variable frequency (2-7
Hz) and an amplitude of 50 nT. The electric conductivity and dielectric
properties of the solution were investigated by voltammetric techniques in
combination with non linear dielectric spectroscopy (NLDS), which allow the
examination of the dielectric properties of macromolecules and molecular
aggregates in water. The experiments target to elucidate the biological
relevance of the observed EMF effect on molecular level.
Results: An ion cyclotron resonance (ICR) effect of
glutamate previously reported by the Fesenko laboratory 1998 could be
confirmed. Frequency resolution of the sample currents was possible by NLDS
techniques. The spectrum peaks when the conditions for ion cyclotron resonance
(ICR) of glutamate are matched. Furthermore, the NLDS spectra are different
under ICR- and non-ICR conditions: NLDS measurements with rising control
voltages from 100-1100 mV show different courses of the intensities of the low
order harmonics, which could possibly indicate "intensity windows".
Furthermore, the observed magnetic field effects are pH dependent with a narrow
optimum around pH 2.85.
Conclusions: Data will be discussed in the context
with recent published models for the interaction of weak EMF with biological
matter including ICR. A medical and health relevant aspect of such sensitive
effects might be given insofar, because electromagnetic conditions for it occur
at many occasions in our electromagnetic all day environment, concerning ion
involvement of different biochemical pathways.
Background
Weak magnetic fields and extremely low frequency electromagnetic
fields (EMF) are omnipresent in natural environmental and increasingly man-made
factors. A possible influence on life processes was already mentioned in the
late 19th century [1]. It is now recognized, that many organisms are
capable of perceiving such fields, while less is known on the elementary
perception. Three types of mechanisms are considered therefore, the orientation
of ferromagnetic particles in tissues [2], singlet-triplet mixing states of
macromolecules building radical pairs [3], and the ICR, whose persistent
investigation began with the works of Liboff [4].
Ferromagnetism has been implicated in animal navigation
(e.g. compass mechanism of migratory birds [5], and the magnetotaxis of certain
bacteria [6]. The radical pair mechanism is independent of ferromagnetism and
has putatively a higher magnetic sensitivity. It has been primarily studied in
photosynthetic reaction centers and the respiratory chain [7], where triplet
yields are modulated by electromagnetic interaction with fields as low as about
50 |iT [8]. Already two decades ago effects were described by Blackman et al.
[9], and later by [10-12], which require a combination of static and
alternating magnetic fields. It turned out, that the magnetic field strength B
of the static component and the frequency f of the alternating EMF relate to
the "ion cyclotron resonance (ICR) formula":
![]()
whereas m is the mass and q the charge of ions
involved. The explanation of the mechanism of this effect in an aqueous, more
or less viscous environment seems to be difficult, nevertheless there are some
efforts. Liboff [13] suggested that magnetic fields can interact in a resonant
manner with endogenous AC electric fields in biological systems, instead of a
direct interaction with external AC magnetic fields. Binhi [14] reviewed the
mechanisms of magnetobiological effects, and tried to estimate the sensitivities
and involved molecular topologies. Adair [15] questioned a model involving
altered transition rates of excited ions by weak EMF, while others [16]
consider the ionic environment, eg. properties of the water, with Ca2+ as
the most investigated ion. An altered Ca2+-transport was found in
human lymphocytes [4]. The motility of benthic diatoms is effected, if ICR
conditions are matched for Ca2+ and K+ in the range of 8-64 Hz, and
static field strengths comparable to geomagnetic fields [17]. The germination
rate of Raphanus sativus was altered, when the ICR conditions for Ca2+,
K+ and Mg2+ were applied to the seedlings [18]. ELF
effects on macromolecules indicate an ICR effect possibly caused by
additionally involved alternating electric fields [ 19 ]. It is noteworthy
remarkable that
ICR conditions can be matched by combinations of the
local geomagnetic field and man-made electromagnetic fields, especially the
frequency range of power lines (50 or 60 Hz). Liboff et al. [20] suggest to
consider ICR effects for the evaluation of epidemiological childhood leukaemia
studies. The assessment of elevated brain cancer risk has been evaluated by
Aldrich et al. [21 ] on the assumption of interactions of the geomagnetic field
and a 60 Hz field component from power lines.
NLDS was developed during the past decade in order to
investigate dielectric properties of small particles in aqueous solutions,
using relatively simple electrochemical equipment. In the simplest case, a
sinusoidal alternating electric field is applied to the solution by 2
electrodes, using peak to peak voltages up to 1.5 V and frequencies of 1 to
1000 Hz. Particles with a dielectric constant different from that of their
environment (generally water) distort the field. This induces alternating
voltages over and currents through the solution, which are detected by 2 auxiliary
electrodes in order to avoid polarisation effects. Phase shifts and distortions
of the obtained signals, as compared to the input signal, contain information
on damping and relaxation kinetics. Therefore, the signals are Fourier-transformed
and evaluated as power spectra in the frequency domain [22-24]. Usually, the
sample is compared to a reference, which lacks the solute, but otherwise is
identical. Sample and reference can either be measured one by one in a single
chamber device, or simultaneous with a "dual-chamber" setup, which
also needs a two channel data acquisition, and allows a real-time
differential-NLDS (DNLDS). The data are usually calculated using the decibel
(dB) scale for the intensity (power) Pn:
![]()
Where U(n)sample is the signal output
intensity of the nth harmonic from the sample measuring channel, and
U(n)ref the corresponding value from the reference channel.
Zhadin et al. [25] reported the alteration of electric
properties of an electrolyte under ICR conditions. They found an increasing
ion current through an aqueous glutamic acid (Glu) solution in narrow frequency
bands (resonance), which could be described by equation (1). These results are
the starting point for the present work, which is aimed to further elucidate
this conduction mechanism. The influence of the concentration of Glu has been
investigated, and the time resolved electric current through the solution is
analyzed using "non linear dielectric spectros-copy" (NLDS), which
indicate microcolloidial properties of the solvent-solute system. The NLDS was
amplified by two features: The option of simultaneous data acquisition in two
cuvettes (DNLDS), and the frequency resolved vol-tammetry (FRV), whereby
simultaneous a AC voltamme-try is performed [26]. By recording NLDS spectra at
varying electrode voltages from e.g. 100-1100 mV, additional information was
obtained on redox potentials. The electrode current never increases
proportionally with the applied voltage but remains constant in the range of
the counter voltage to an existing redox potential given by the investigated
electrode-electrolyte system. This was used to improve the method by recording
differential spectra (DNLDS). The integral over the spectrum represents one
data point of a simple (not frequency resolved) AC vol-tammetry, while the
intensity course of corresponding spectral data points provide information
about the dielectric state of the redox reaction, e.g. its capacitive,
time-dependent properties.
Methods
Preparations
All preparations were performed with doubly de-ionized
water. The solutions were degassed and stored under Argon, in order to avoid
oxidation of the solute and increased electrode fouling during the subsequent
measurements. An acidic solution of 2.24 mM Glu was adjusted to pH = 2.85 ±
0.03 with a stock solution of 5 mM HCl. Equilibration was assumed, when the pH
varied less than ± 0.03 for at least one minute. All procedures were performed
at 20 °C. For yielding a reference signal, an aqueous solution of HCl was
provided by diluting the HCl stock solution with water to pH = 2.85. All
solutions were stored at 4 ° C under Argon.
Apparatus
The experimental arrangement for differential non-linear
dielectric spectroscopy (DNLDS) is shown in Figure 1. It allows the
simultaneous evaluation of a sample and a reference under same conditions. A
double cuvette (K) is built up by two standard photometric plastic cuvettes (1
1 x 4.3 cm). Both contain electrode arrays (E1, E2) consisting each
of 4 gold wires (Au 99.9%, Johnson Matthey, Karlsruhe) with a diameter of 0.25
mm, mounted parallel at a distance of 2 mm on a teflon frame. The required sample
volume was 1 ml. These electrode carriers are mounted on a stable socket for
electric connection and mechanical adjustment (not shown). The cuvettes are
enclosed by a hermetically sealable plastic tank (T) with a copper bottom,
which is filled at a height of 2 cm around the cuvettes with water for thermal
coupling to an outer temperature controlled water bath. The setup is kept under
Ar atmosphere throughout the experiment. Thermic control (20 ± 0.1 ° C) of the
cuvettes is provided by a water thermostat (Haake "G",
Karlsruhe-Berlin, Germany) with a sequential home built temperature fine
controller, ensuring highly stable working conditions for the electrodes. Once
assembled, these components form a mechanically stable
unit, with in- and outlets for gas and samples by small teflon hoses (not
shown). The assembly is placed in the center of a solenoid (S), consisting of
two cylindrical coils with a inner diameter of 16 cm and a height of 7 cm for
applying the vertically orientated EMF (B). The coil for the static field
component consisted of 300 turns of coated copper wire (diameter 0.5 mm), the
other coil was winded above and had 50 turns.
For electric and magnetic shielding the complete setup
resides in a grounded double-walled Permalloy box with a total wall thickness
of 1 mm. A overall inhomogeneity < 0.3 % of the generated fields was
determined inside the box with a triaxial CXM539 magnetometer (CMT GmbH,
Herrsching, Germany) over the cuvette locations. For coil calibration the
relation of field strength to coil current could be ascertained directly in measurement
series with the magnetometer for 0.1 -100, showing a overall deviation from
linearity < 0.2 % (DC and AC), so currents corresponding to even lower
field strengths were obtained by extrapolation.
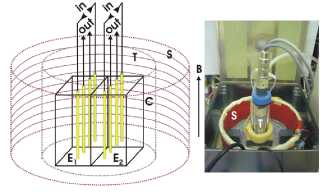
Figure 1
Experimental facility. Schematic sketch of
the arrangement for the differential NLDS (DNLDS) experiments (left,
components not drawn to scale) and photograph of the opened permalloy shielding
box with the assembled sample carrier (right): Two arrays of 4 gold electrodes
(E1, E2, length 10 mm, distance 2 mm) each are located in
two adjacent perspex cuvettes (C) of 1 * 1 * 4.3 cm, enabling simultaneous
acquisition of two liquid samples (used volume 1 ml each) under the same
environmental conditions. The cuvettes are enclosed by a tank (T) for providing
an Argon protection gas atmosphere. This all is mounted on a socket housing
water temperature control and magnetic field monitoring, and is centered
inside a cylindrical solenoid (S) consisting of 2 coils with a inner diameter
of 16 cm and a height of 7 cm for independent generating the static and the
alternating magnetic fields of vertical direction (B). The input signal to
the sample is applied by the electrodes labeled "in", the probe
signals are taken by the electrodes labeled "out" and connected to
preamplifiers with symmetric inputs. The complete arrangement is enclosed by a
shielding box of 1 mm Permalloy, which is bonded inside with perspex.
Signal processing was mostly done as previously
described [27]. Figure 2 shows the schematic circuit diagram of the special
NLDS measurement setup used here: The sinusoidal controlling voltage (100-1100
mV) for NLDS with a frequency of 2 Hz was applied to the two outer electrodes
by a symmetric amplifier (output impedance 50 Q). The inner two electrodes
were connected to the input ports of a differential preamplifier. Because a
simultaneous examination of two samples under same conditions is required, a
second identical electrode array with preamplification must be available. The
resulting signals were digitized by a computer controlled multi channel
DA/AD-converter (Lab-PC+, National Instruments, Austin TX U.S.A.). This board
also supplied the voltages for the NLDS and the control of the EMF. A function
generator (Krohn-Hite Model 5200) generated the sine curve for the AC magnetic
field with a frequency accuracy of 0.1 %. The two operational power amplifiers
of a OPA 2541 chip drove the solenoids generating the constant as well as the
variable magnetic field components, which were monitored by the coil currents
and the magnetometer.
For cleaning, the electrodes were first treated with
chro-mosulfuric acid for 1 h at room temperature and intensively rinsed with
de-ionized water. This procedure was repeated approximately once per week. An
improved long-term electric stability was obtained by slight modifications of
the treatments described by Woodward et al. [23] and Yardley et al. [28]: The
electrodes were additionally washed with chloroform, sonicated for 20 min in a
detergent solution (0.5 % Triton X-100 in water), treated with CaCl2
(0.5 M in water) in a ultrasonic bath (Bachhofer, Reutlingen), and finally
rinsed with de-ionized water (<2 \\S). This treatment resulted in amplitude
deviations < 5% over an experimental session of up to 2 h. If electrodes
were not used for DC measurements, but for NLDS, they were additionally coated
with a thin polymer film in order to improve noise reduction and stability
[24].
Measurement techniques
The cuvettes could be charged with the test solutions,
discharged and rinsed through the teflon hoses by a syringe. A sample volume
of 1 ml was used. Device specific, systematic errors were routinely checked by
exchanging the electrode arrays used for sample and reference measurements and
testing several cuvettes of the same type. After loading they were flooded with
Argon for about 10 min. in order to remove O2 from the solutions,
avoid oxidation reactions and subsequent arising of reactive oxygen species
(ROS) in the solute, then the hoses were sealed with rubber caps. After
reaching a stable temperature of 20 ± 0.2°C, measurements were started. First
10 "dummy" scans were performed, in order to obtain a dynamic equilibration
of the electrodes. Bdc = 40 цТ was selected as static magnetic field
component for the ICR condition, because it is of comparable intensity as the
natural geomagnetic field of the earth. A new sample was used for every
experiment, an "aging effect" of the test solutions was observed,
similar to an earlier seen effect, which resulted in a decreasing
reproducibility for experiments with magnetic field exposed lipid vesicles
[27].
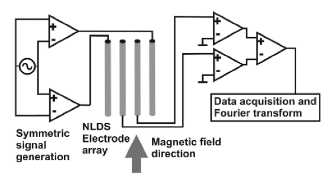
Figure 2
NLDS measurement setup (schematic). The
voltage control signal is applied by a symmetric amplifier to the outer two of
a plane 4 gold electrode array. The NLDS signal generated by the sample is
clamped by the inner two electrodes. It will also be preamplified
symmetrically, digitized by a fast computer controlled analog-digital converter
and fourier analyzed by the data acquisition software. The static and dynamic
magnetic field component is directed parallel to the electrode plane. The
measuring station provides two such NLDS setups, enabling a simultaneous
examination of two samples under same conditions.
Three types of techniques for measuring the electric
currents in the solutions were applied, always using the gold electrode array
described above:
1) For the validation of the ICR parameters of the
Glu-HCl solution, the experiment of Zhadin et al. [25] was repeated. The DC
voltage of 80 mV was applied to the outer electrodes (+40 mV and -40 mV), and
the current through the solution was calculated from the resulting voltage
between the inner electrodes. The current calibration was earlier performed
with 10 mM HCl and the Glu-HCl solution. By that way, used by many established
vol-tammetric techniques [29], superimposing electrode transition potentials
can be widely avoided, in contrary to
a direct current measurement with a two electrode
system. A constant magnetic field Bdc = 40 |iT or 50 |iT and a frequency
sweep of the alternating magnetic field Bac = 50 nT (parallel to Bdc)
from 2 to 7 Hz with 0.025 Hz/s and a resolution of 0.05 Hz were used.
2) For the
investigation of the ICR transition with NLDS the same magnetic field setup is
used like described under 1), the NLDS sine wave was applied on the electrodes
(instead of the DC-voltage) and a constant magnetic field Bdc = 40 цТ was
used.
3) Finally the FRV setup allowed the frequency
analysis of the electric signals with variable amplitudes using the DNLDS
technique described above. Glu-HCl
samples were exposed to constant ICR conditions (Bdc = 40 цТ and
Bac = 50 nT, 4.14 Hz fixed), for reference experiments only the
static component (Bdc = 40 цТ) was applied with Bdc switched
off. The amplitude of the sinusoidal scanning voltage was increased in each
experiment from 100-1100 mV in steps of 10 mV, record by record, the duration
of each cycle was 4 s. The two data sets (from Glu-HCl and HCl sample)
yielded by every
single record were seperately Fourier transformed in
order to get the spectra, these two spectra were divided by themselves (Glu-HCL
spectrum by HCl spectrum) and the ratio spectrum was subsequently attached to a
data file on a harddisc for later evaluation.
Results
Exploring Zhadin et al.
's experiment
Applying a constant magnetic field of Bdc =
40 цТ at pH 2.85 and scanning the alternating magnetic field Bac
from 2-7 Hz in steps of 0.05 Hz, a sharp peak was observed at 4.15 Hz. The peak
current is about 20% larger than the mean ionic current of 7.4 nA, the peak
width at half-height is 0.3 Hz (Figure 3). Equation (1) was validated by
repeating the experiment ten times at an altered static magnetic field strenght
of Bdc= 50 цТ. The current peak shifted to 5.2 ± 0.05
Hz with a height of 9.08 ± 0.3 nA, which lies approximately 22% over the mean
ionic background current. These data verify the results of Zhadin et al. [25],
and the field-dependence is in agreement with Eqn. 1. The signal was observed
over a concentration of 2-10 mM. The signal became too small at cGlu
< 2 mM, and there was insufficient solubility cGlu >10 mM (at
20 °C). Subsequently, the pH-dependence was determined under identical magnetic
field and scanning conditions mentioned above. Resonance effects are only seen
in a narrow pH range of Glu-HCl (pH 2.75 - 2.90), with an maximum at 2.85, and
vanishes outside this range.
After this verification of the experiment of Zhadin et
al. [25], these electric measurements were accompanied by some UV-VIS light
scattering investigations, which should give information about possible
colloidal properties of the sample. Glu-HCl solutions were investigated at a
wavelength of X = 260 nm with the pH adjusted from pH 2.55 to 3.25, showing a
significant scattering maximum around pH 2.8 (data not shown).
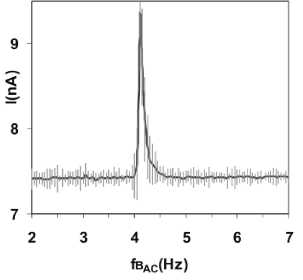
Figure 3
Current increase at ICR (DC). Current increase
through the
glutamic acid /HCl solution (2.24 mM, pH = 2.85) at and near ICR conditions.
The static magnetic field strength is Bdc = 40 цТ, the
amplitude of the alternating field Bac is 50 nT, the frequency
resolution Af = 0.05 Hz. Course using a constant electrode voltage of 80 mV
("Zhadin's experiment").
Further some DC voltage scans were performed with the
gold electrode array for Glu at pH 2.85, and for dilute HCl adjusted to pH
2.85, applying only a static magnetic field Bdc= 40 |iT (no Bac).
A voltage range of 100-1000 mV was selected to allow a comparison with the
voltammetric information out of the frequency resolved voltammetry (FRV).
Again, maxima of conductivity were obtained, they lie at 250 ± 10 mV for
Glu-HCl and 280 ± 10 mV for water/HCl pH 2.85 (data not shown).
NLDS spectroscopy
Next, the solutions were investigated by NLDS spectroscopy,
in order to investigate in which way the frequency composition of the current
spectra will change, when the predicted ICR condition for Glu-HCl is matched (Bdc
= 40 цТ and a Bac withf= 4.15 Hz). 15 experiments were performed
and averaged. Figure 4 shows the power of the 2nd harmonic
(referenced against dilute HCl, pH 2.85). The
full dataset is shown in Figure 5 on an absolute
current scale, for magnetic frequencies of 4.00-4.30 Hz in a 3d-representation.
The 1stharmonic is split up into 2 closely spaced peaks around the ICR
frequency. This is also well seen in Figure 4, an effect not seen in the
"Zhadin's" DC experiments [25] without frequency resolution. Furthermore
an increase of the 2-6 harmonics is seen in Figure 5 for 4.10 and 4.20 Hz
magnetic frequency, closely flanking the ICR value. The average standard
deviation of these experiments was 8.2 % of the average Power of all DNLDS
spectra.
Kinetics
The following kinetic experiment should clarify, in
which way the conductivity of the Glu solution is affected by repeated
transitions through the ICR conditions. 12 experiments were performed, each
with a new Glu-HCl sample.
100 DNLDS spectra were recorded with single 2 Hz sinus
signals with 100 mV amplitude. Bdc = 40 цТ was
permanently applied in all experiments, while Bacwithf= 4.15 Hz was
applied only during measurement no. 20-39 and 60-79. Subsequently, the courses
of the lowest 5 harmonics (for 2, 4, 6, 8 and 10 Hz) were normalized to ± 1,
and all 12 experiments were averaged, Figure 6 therefore represents the
kinetics averaged over a total of 60 datasets. Because of the standardization,
data are scaled in arbitrary units (a.u.). The power difference between
"on" (exposure) and "off" periods is 1.38 ± 0.34 dB, standard
deviations are drawn as bars.
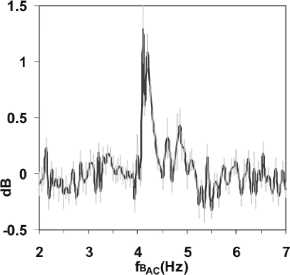
Figure 4
Current increase at ICR (AC). Course of the
2nd harmonics of NLDS spectra taken for every scanned frequency of
Bac. Data were related to reference scans with Bdc = 40 цТ, but
without Bac. The grey bars indicate standard deviations. Other
conditions like Figure 2.
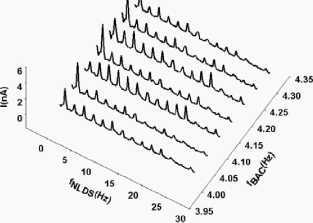
Figure 5
NLDS spectra on ion cyclotron resonance
(ICR) transition. 3D-representation of the NLDS resolved current through a
glutamic acid / HCl solution (2.24 mM, pH 2.85) during transition of the ICR
condition (static magnetic field Bdc = 40 |_iT, alternating field Bac
= 50 nT, fBAC =4.14 Hz) in steps of 0.05 Hz.
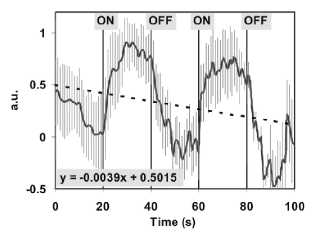
Figure 6
Current kinetics of switched ion cyclotron
resonance (ICR) condition. Kinetics in arbitrary units (a.u.) of the ICR
condition to a glutamic acid / HCl solution (2.24 mM, pH 2.85). The static
magnetic field Bdc (40 цТ) was applied permanently, the alternating
field Bac (50 nT, 4.14 Hz) was applied as indicated by
"on" and "off". One experiment consists of a set of 101
DNLDS spectra performed by a 2 Hz sinus signal with 100 mV Amplitude. The data
first 5 harmonics (2, 4, 6, 8, 10 Hz) where normalized and then averaged. Data
are calculated out of 12 independent experiments. The grey lines mark the
standard deviations, the dotted straight line shows the linear regression of
the negative drift, represented by the equation y = -0.0039t + 0.5015.
Changes of the signal intensity become obvious, when
switching the alternating magnetic field on or off. Over the entire experiment
there seems to be a constant drift which we take as an indication for
irreversible processes. This drift is indicated by the dotted line, which
results from a linear regression of the entire dataset (-0.0039t + 0.5015). The
course seems to reach a new steady value after on/off switching of the
alternating magnetic field with a time delay, which seems larger, when ICR is
switched off. The average current change after the switching processes is -0.2
nA/s, the negative values result from comparison with a reference.
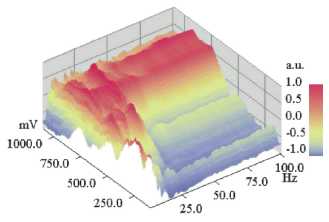
Figure 7
DNLDS resolved voltammogram dataset (normalized to spectral axis):Normalizations of the
DNLDS resolved voltammogram dataset (sinewave 2 Hz with amplitude rising from
100-1100 mV, details of gaining data see text) of a Glutamic acid / HCl
solution (2.24 mM, pH 2.85) under ICR Conditions (Bdc= 40 uT, Bac=
50 nT, 4.14 Hz). Datapoints are colored resp. shaded according to the scale on
the right border. Normalization of the spectra for each Amplitude shows a
rising proportion of higher frequencies with a local (at about 500 mV) and a
total maximum (at about 700-800 mV). By contrast, the proportions of the base
frequency (2 Hz) and the lower harmonics decline.
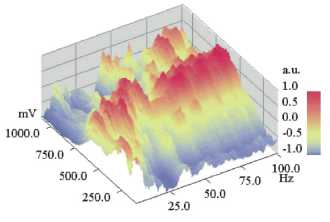
Figure 8
DNLDS resolved voltammogram dataset (normalized to voltage axis):The same dataset and
representation style like Figure 9, but with normalization of the single
vol-tammograms for each frequency. For low frequencies (<5 Hz) Voltammograms
have a maximum at about 250 mV, comparable to the pure DC volt scans. But with
rising spectral harmonics voltammetric maxima occur at about 700 mV with
overlaying intensity patterns of 4 and 16 Hz in distance. Worthy of remark are
62, 78 and 94 Hz, these all are four folds of the used base ICR resonance
frequency 4.14 Hz.
Differential NLDS experiments with variable control
voltages (FRV)
Finally, the FVR method should show the intensity distributions
of the harmonics of the DNLDS spectra and their dependence from the used
amplitude of the electrode input voltage. Again Glu-at pH = 2.85 was
investigated, using diluted HCl (pH 2.85) as the reference. The ratio of the
resulting two NLDS power spectra was calculated according to equation (2),
resulting in a logarithmic DNLDS spectrum. 101 such scans (4 s each) were
performed for every single experiment, during which the amplitude of the
applied course of 4 periods of a 2 Hz sine voltage increased from 100 to 1100
mV in 10 mV steps. Corresponding datapoints of the successive single DNLDS
spectra generated one AC voltammogram each, for the respective frequency.
Altogether, a set of 201 frequency resolved voltamogramms was obtained, because
every spectrum contains 201 data values. Subsequently 20 such experiments were
performed in which the solution was exposed to ICR conditions, alternating with
20 experiments, were only the static field was applied (Bdc = 40 цТ),
but not Bac. Each of the two groups of experiments were averaged
separately. Then the two resulting datasets were subtracted (ICR experimental
data minus data of the experiments with ICR condition switched off). This
differential
dataset had a total amplitude of 2.03 ± 0.38 dB, presenting just the
contribution of Glu, because the voltammetric background from HCl was
subtracted.
Subsequent data normalization should allow a better
comparison of spectra recorded with different amplitudes and likewise of
voltammograms at different frequencies. Therefore in Figures 7, 8 the full
dataset is shown, again after standardization in a range from - 1 to 1. Figure
7 presents the data with standardization on the voltage axis for the
voltammograms belonging to the individual frequencies. Figure 8 contains the
same dataset, but with standardized spectra. The intensity maximum shifts with
rising frequency from approx. 250 mV to 500 mV for frequencies <40 Hz, it
then remains constant around 500-700 mV for higher frequencies. So most
information will be contained in the low harmonic orders. Figure 9 shows the
voltage dependent behaviour at the NLDS fundamental frequency (2 Hz) and three
harmonics in the lower range (4, 8, and 12 Hz). Broad maxima are obvious, which
seem to shift to higher voltages with increasing harmonic order by about 60
mV/Hz. The intensities increase to a local maximum at approx.25 Hz. At higher
frequencies, the amplitude effects caused by the exposure to ICR conditions
have a local maximum at 480 mV and merge into
a continuum beyond
750 mV for
all higher
frequencies, according to the predominating capacitive
damping of aqueous solutions with rising frequency.
Discussion
All results suggest the existence of a sensitive
magnetic field effect on the conductance of a aqueous Glu solution. The effect
shows no linear dependency of magnetic field parameters, it is rather peaking
in a narrow range of combinations of static magnetic field strengths and frequencies
of additional alternating magnetic fields, described by Eqn. 1.
Several precautions were applied, in order to avoid
artefacts as best as possible. So it has been shown, that the signal to noise
ratio will be improved significantly by clamping the voltage drop inside the
electrolyte and, if needed, by a subsequent calculation of the current by calibration
functions, instead of a direct current measurement. These techniques are wide
spread in vol-tammetry [26] and obligatory in NLDS [23]. Because the voltage
clamping ideally should work without any electric current flow, the electrode
surface transition potentials could more likely be excluded for causing the
observed EMF effect ("electrode effects"). It should be least then
apply, if a cell voltage is used bellow the electrochemical potentials of the
electrode-electrolyte system, and independent from the other experimental
setup.
Different explanations are recently discussed for the
kind of EMF effect observed here, all of them suppose a non linear oscillator
principle described by quantum mechanical terms, allowing energetic
interactions with the environment far below the thermal equilibrium of life
processes. This search for "wave functions fitting in a properly sized
box" should consequently provide an explanation for the repeatedly
observed effects of effectiveness windows, regarding specific field strengths
and frequencies of the EMF, e.g. seen on green algae grown in a magnetic
gradient [30]. Ion channels of biological membranes were proposed in a early
work of Liboff [31] for a suitable environment supporting ICR. A model of Binhi
et al. [ 14,32] is based on an interference mechanism of quantum states of ions
within protein cavities. The quantum dynamic description of an ion is given for
the case of ion-protein complexes that rotate in magnetic fields. The individual
molecular rotation is taken into account. The spatial distances considered here
are in the size of the molecules involved, cavities built by proteins, and
their bond lengths.
A quantum electrodynamic description needing no additional
supporting structures like protein molecules or lipid membranes was worked out
by Giudice et al. [33], as an attempt to explain the experimental results of
Zhadin et al. [25]. It is based on an underlying two-phase domain model of the
solvent water, in which at room temperature ~40% of its volume is organized in
spheres with a diameter of approximately 100 nm providing coherence for the
included water molecules. These spheres should establish a stable frontier
region with a thickness of ~4 nm, which allows a undisturbed ion movement,
separated by an energy gap 0.26 eV against the surrounding, non coherent water
phase. The circulation frequency of the ions in the frontier region should be
given by equation (1) and be dependent on the external magnetic field strength.
An additional superimposed alternating field Bac with the same
frequency will modulate the radii of the orbits. As a consequence, the ion
orbits fit no longer the frontier region and the ions escape into the
surrounding water phase, where they increase the conductance. This model also
tries to describe the results of [25] quantitatively, but takes therefore in
account the electrode geometry of the original experiment.
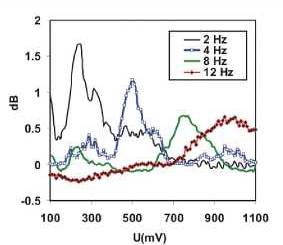
Figure 9
Extracted voltage courses of the DNLDS
resolved voltammogram
dataset. Voltammograms for some harmonics of the DNLDS resolved voltammogram
dataset (sine wave 2 Hz with variable amplitude 100-1 100 mV, not normalized
here, see text for details) of a glutamic acid / HCl solution (2.24 mM, pH
2.85) under ICR Conditions (Bdc = 40 u.T, Bac=50nT, 4.14
Hz).
Further attention should turned to the comparably long
persistence time of the ICR state (see Figure 6) implying a comparable long
lifetime. Considering the existence of supramolecular orders of liquid water,
such long lifetimes (>10 s up to hours) have been predicted for these states
sensitive to weak EMF at biologically relevant temperatures. Ponomarev et al.
[34] propose linearly ordered chains and clusters like a liquid crystal phase
in water which interact with EMF. The soliton theory was applied for
description. Studies on the electromagnetic "memory effect" of water
implicate even high sensitivity and long lifetimes [35], and are probably
caused by the same mechanism as the effects observed here. An more hypothetical
two phase model also providing boundary layers has been emphasized by Colic et
al. [36]. The authors discuss the presence of micro-dispersed gas bubbles. But
this possibly can be discarded more than likely in our experiments, because
degassed solutions were used throughout.
Special attention deserve the obvious frequency dependent
amplitude windows of the dielectric currents, which are observed in the NLDS
experiments (FRV) with variable amplitudes. Two explanations for this effect
would be possible. The additional electric field caused by the AC signal of
the NLDS could modulate the charged particles inside a "quantum box",
whatever will be the reason for its existence. An indication for such a
mechanism could be the more or less ordered local maxima of conductivity in
spectral as well as in the voltammetric domain of the data. But the frequency
dependent conductivity band shifts of the FRV experiments (Figure 9) could
either result from a "simple" interference with the frequency of the
Bac field, which can be tuned on its part in discrete multiples,
corresponding to possible "overtones" of the ICR (orbital) frequency
of the ions. Interactions of the internal electric
and external magnetic field could probably cause side
band modulations. They are probably responsible for the seen splitting up of
the ICR resonance peak (figure 4) when using a AC instead of a DC probe
voltage.
For progressed investigation of the observed effects
some additional properties of the electric charge environment of the Glu ion
should be known. The isoelectric point of Glu is at pH 3.22, the pK of the
a-COOH-group is 2.19, that of the P-COOH at 4.25, the small optimum for the EMF
effect around pH 2.85 does not coincide with any of these points. The
Debye-Hueckel radii for Glu are about 5 nm, they determine the free ion
movement, and influence consequently the current. Moreover, they could be
responsible for a proper fit of the spatial ion distribution to the environing
structure whatever, which enables a resonant EMF effect.
Conclusion
The results strengthen the idea, that weak
electromagnetic fields can cause an resonance effect on molecular or even
supramolecular scale in electrolyte solutions [33,35], and thereby possibly,
influence biological processes, which involve these electrolytes. In this work,
the electric currents in a glutamic acid solution were investigated with
frequency resolution after applying weak EMF. The resonance peaks and the
overtone-analysis in response to weak static plus alternating EMF support the
existence of the ICR phenomenon in aqueous solutions containing electrolytes. A
analysis of the data is possible under the basic assumption of a far reaching
principle of arrangement (realized e.g. by the solvent matrix), which allows
quantum electro dynamic processes on the nano-physical scale or larger.
In general any kind of a suitable coherence mechanism
should be essential for the observed effects in a dense medium like water,
which had to support an energy gap against the thermal fluctuations of the
environment, and enable a movement of charged particles which are only
magnetically coupled to their outer environment. Not at least, the high
sensitivity of the ICR to weak electromagnetic fields should be regarded. It
makes the modulation of biological processes by the weak EMF of our everyday
environment conceivable [37], possibly inducing likewise health risks and
chances for new therapies, hardly minded till this day. Especially concerning
the earlier [25] and the present study, glutamate is a neuro-transmitter and is
involved in a couple of other biological processes.
The geomagnetic field, with all its anomalies and
regional differences [38], in combination with all the natural and civilizing
EMF, overlap with a wide range of possible ICR of biologically
relevant ions. But
also technical
applications basing on the ICR are imaginable, as a
potential direction of future research. Its further investigation will be
worthwhile, by new experiments, comparing field studies of health phenomena,
and not at least a further clear up of its physical principle.
List of abbreviations
EMF: (low frequency) electromagnetic field
ICR: ion cyclotron resonance
NLDS: non linear dielectric spectroscopy
DNLDS: differential non linear dielectric
spectroscopy.
FRV: frequency resolved voltammetry
Glu-HCl: A glutamate solution adjusted to pH 2.85 with
hydrochloric acid (HCl).
Authors' contributions
The author itself carried out all experiments and
drafted the manuscript.
Acknowledgements
The author thanks H. Scheer (Miinchen) for scientific
care and frequent discussions for many years.
References
- Zhadin
MN: Review of Russian literature on biological action of DC and
low-frequency AC magnetic fields. Bioelectromagnet-ics 2001,22:27-45.
- Kirschvink
JL: Magnetite biomineralization and geomagnetic sensitivity in higher
animals: an update and recommendations for future study.
Bioelectromagnetics 1989, 10:239-59.
- Ogrodnik
A, Krueger HW, Orthuber H, Haberkorn R, Michel-Bey-erle ME., Scheer H:
Recombination dynamics in bacterial pho-tosynthetic reaction centers.
BiophysJ 1982, 39:91-9. 82
- Liboff
AR, Rozek RJ, Sherman ML, McLeod BR, Smith SD: Calcium-45 ion cyclotron
resonance in human lymphocytes. J Bioelectr 1987,6:13-22.
- Wiltschko
R, Wiltschko W, Munro U: Light-dependent magne-toreception in birds: the
effect of intensity of 565-nm green light. Naturwissenschaften 2001,
87:366-369.
- Devouard
B, Posfai M, Hua X, Bazylinsi DA, Frankel RB, Buseck PR: Magnetic from
magnetotactic bacteria: size distributions and twinning. Am Mineral 1998,
83:1 387-1398.
- Waliszewski
P, Skwarek R, Jeromin L, Manikowski H: On the mito-chondrial aspect of
reactive oxygen species action in external magnetic fields. Photochem
Photobiol 1999, 52:137-140.
- Adair
RK: Effects of very weak magnetic fields on radical pair reformation. Bioelectromagnetics
1999, 20:255-63.
- Blackman
CF, Benane SG, Rabinowitz JR, House DE, Joines WT: A role for the magnetic
field in the radiation-induced efflux of calcium ions from brain tissue in
vitro. Bioelectromagnetics 1985, 6:327-37.
- Belova
NA, Lednev VV: Extremely weak alternating magnetic fields affect the
gravitropic response in plants. Biofizika 2001, 46:122-125.
- Belyaev
IY, Alipov ED: Frequency-dependent effects of ELF magnetic field on
chromatin conformation in Escherichia coli cells and human lymphocytes.
Biochim Biophys Acta 2001, 1526:269-276.
- Vorobyov
VV, Sosunov EA, Kukushkin NI, Lednev VV: Weak combined magnetic field
affects basic and morphine-induced
rat's EEG. Brain Research 1998, 781:182-187.
- I
3. Liboff AR: Electric-field ion
cyclotron resonance. Bioelectromagnetics 1997, 18:85-7.
- 14. Binhi VN, Savin AV: Effects of weak
magnetic fields on biological
systems: physical aspects. Physics-Uspekhi (Translation of Uspekhi Fizicheskikh Nauk) 2003,
46:259-91.
- Adair
RK: A physical analysis of the ion parametric resonance model.
Bioelectromagnetics 1998, 19:181 -91.
- 16. PonomarevOA, SusakIP, Fesenko EE,
ShigaevAS:Thermodynamic properties
of bulk knitted structures.
Biofizika 2002,
47:395-410.
- 17. McLeod BR, Smith SD, Liboff AR:
Calcium and potassium cyclotron
resonance curves and
harmonics in diatoms (A. coffeaeformis). J Bioelectr 1987, 6:153-68.
- Smith
SD, McLeod BR, Liboff AR: Testing the ion cyclotron resonance theory of
electromagnetic field interaction with odd and even harmonic tuning for
cations. Bioelectrochem Bioenerg 1995,38:161-167.
- 19. Zhadin MN, Fesenko EE: Ionic
cyclotron resonance in biomolecules. Biomed Sci 1990,
1:245-50.
- Liboff
AR, McLeod BR: Power lines and the geomagnetic field. Bioelectromagnetics
1995, 16:227-30.
- 21. Aldrich TE, Andrews KW, Liboff AR:
Brain cancer risk and electromagnetic
fields (EMFs): assessing the geomagnetic
component. Arch Environ Health 2001, 56:3 14-9.
- Davies
E, Woodward A, Kell D: The use of nonlinear dielectric spectroscopy to
monitor the bioelectromagnetic effects of a weak pulsed magnetic field in
real time. Bioelectromagnetics 2000,21:25-33.
- 23. Woodward AM, Jones A, Zhang X,
Rowland J, Kell DB: Rapid and non-invasive quantification of metabolic
substrates in biological cell suspensions using non-linear dielectric
spectroscopy with multivariate calibration and artificial neural networks.
Principles and applications. Bioelectrochem Bioenerg 1996, 40:99-1 32.
- Woodward
AM, Davies EA, Denyer S, Olliff C, Kell DB: Non-linear dielectric
spectroscopy: antifouling and stabilization of electrodes by a polymer
coating. Bioelectrochemistry 2000, 51:1 3-20.
- 25. Zhadin MN, Novikov VV, Barnes FS,
Pergola NF: Combined action of static and alternating magnetic fields on
ionic current in aqueous
glutamic acid solution. Bioelectromagnetics
1998, 19:41-45.
- Buchberger
W: Varianten voltammetrischer Verfahren. In In Elektrochemische
Analysenverfahren Akad. Verlag Heidelberg, Berlin; 1998:85-96.
- Pazur
A: Effects of a switched weak magnetic field on lecithin liposomes,
investigated by nonlinear dielectric spectroscopy. ZNaturforsch C 2003,
58:386-95.
- 28. YardleyJE, Todd R, Nicholson DJ,
BarrettJ, Kell DB, Davey CL: Correction of the influence of baseline
artefacts and electrode polarization
on dielectric spectra. Bioelectrochemistry
2000, 51:53-65.
- Mart
L, Nurnberg HW, Valenta P: Prevention of contamination and other accuracy
risks in voltammetric trace metal analysis of natural waters. Fresenius Z
Anal Chem 1980, 300:350-62.
- Pazur
A, Scheer H: The growth of freshwater green algae in weak alternating
magnetic fields of 7.8 Hz
frequency. Z Naturforsch 1992,47:690-4.
- 3
1. Liboff AR: Cyclotron
resonance in membrane transport. NATO ASI Series, Series A: Life Sciences
1985, 97:281 -96.
- Binhi
VN: Amplitude and frequency dissociation spectra of ion-protein complexes
rotating in magnetic fields. Bioelectromagnetics 2000, 21:34-45.
- 33. Giudice Del E, Fleischmann M, Preparata G, Talpo G: On the
"unreasonable" effects of ELF magnetic fields upon a system of
ions. Bioelectromagnetics 2002, 23:522-530.
- Ponomarev
OA, Fesenko EE: The properties of liquid water in electric and magnetic
fields. Biofizika 2000, 45:389-98.
- Goldsworthy
A, Whitney H, Morris E: Biological effects of physically conditioned
water. Wat Res 1999, 33:1618-1626.
- Colic
M, Morse D: The elusive mechanism of the magnetic 'memory' of water.
Colloids Surf A 1999, 154:167-174.
- Havas
M: Biological effects of non-ionizing electromagnetic energy: A critical
review of the reports by the US National Research Council and the US
National Institute of Environmental Health Sciences as they relate to the
broad realm of EMF bioeffects. Environ Rev 2000, 8:173-253.
- Maus
S, Rother M, Liihr H, Haak V: Kartierung des Magnetfeldes der Lithosphare
mit CHAMP (in German). Zweijahresbericht GFZ Potsdam 2002:1-10.